
Follow the Money
There are literally dozens of political consultants, organizations, and publications which regularly publish their outlook and prognostications on the upcoming mid-term elections, and they're all valid and interesting to varying degrees.
But they're only informed guesses, after all.
Studies have shown that markets, where people's money is at stake are very good barometers and predictors of actual results. Because it's money at risk, this serves to take away a degree of emotion and in theory, results in only cold-eyed analysis.
The Iowa Electronic Market, operated by the University of Iowa Tippie Colege of Business operates such a market which allows people to buy shares in a particular political result and it's been very accurate in the past.
Investors study a host of variables, such as turnout and other factors affecting the potential outcome to ensure their money is on what they believe will happen, not what they may fervently hope will happen. It's not partisanship driving this, it's greed, so to speak.
The IEM runs three markets on the mid-term elections.
Price graphs showing market prices since the markets began June 1st are shown below.
CLICK on any of the charts to see a larger version.
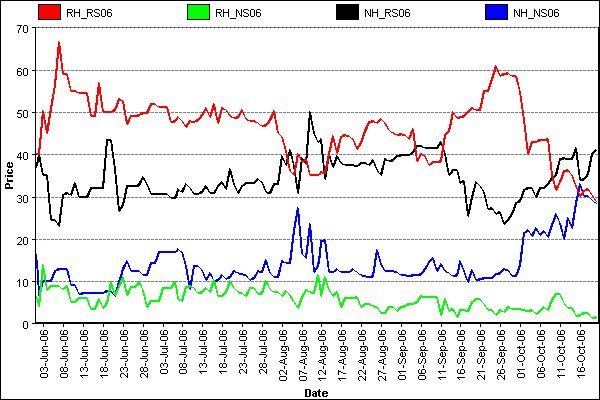
The following chart tracks movement in the market on whether Republicans will hold on to both chambers, lose one or the other, or both.
In the chart below,
Red= Republican House and Senate.
Green = Republican House - Democratic Senate.
Black = Democratic house - Republican senate.
Blue = Democratic House and Senate
The chart below is for the House only.
Red = Republicans gain seats in the House
Green = Republicans hold majority
Blue = Republicans lose majority
The last chart is for the Senate only.
Red = Republicans gain seats in the Senate
Green = Republicans hold majority
Blue = Republicans lose majority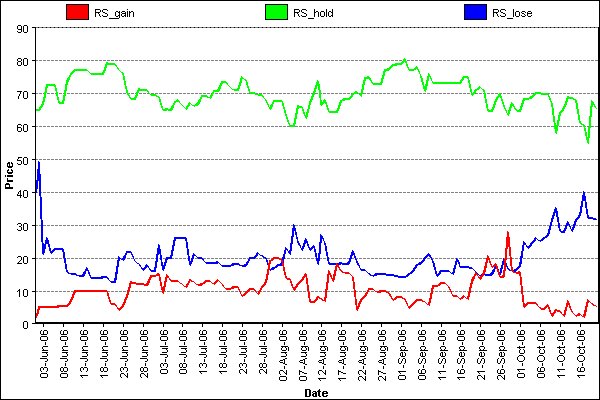
For future reference, graphs and data for all three markets can be found here.
It's of interest to look at the graphs and compare them to what events were taking place at the time. It seems that the Republican fortunes had a big spike at the end of September, though I don't recall what would have caused it.
As evidence that financial markets are inherently more stable than the whims of pundits and the public, the charts don't show a sudden deep plunge relating to the Foley scandal, though the fact that it has continued a steady downward trend indicates that even the "smart money" thinks the Republicans are about to take a drubbing at the polls.
posted by The Inside Dope @ 10/21/2006
2 comments
![]()


2 Comments:
Dope, those are facinating graphs. It really seems to be an accurate reflection of how the opinion of political types have moved over time.
Now what do you think the Bushies will pull for an "October Surprise" to try to salvage their free-fall?
More phoney terror scares? Will they take bin Laden out from where they have him on ice and trot him out?
Will they announce for the 17th time that they've captured al Queda's "number two" guy?
Check out www.npr.org for some news on the elections and some projections.
Post a Comment
<< Home